[Date Prev][Date Next][Thread Prev][Thread Next][Date Index][Thread Index]

Re: [Xen-devel] memory performance 20% degradation in DomU -- Sisu


Hi, all:

I also used the ramspeed to measure memory throughput.Â

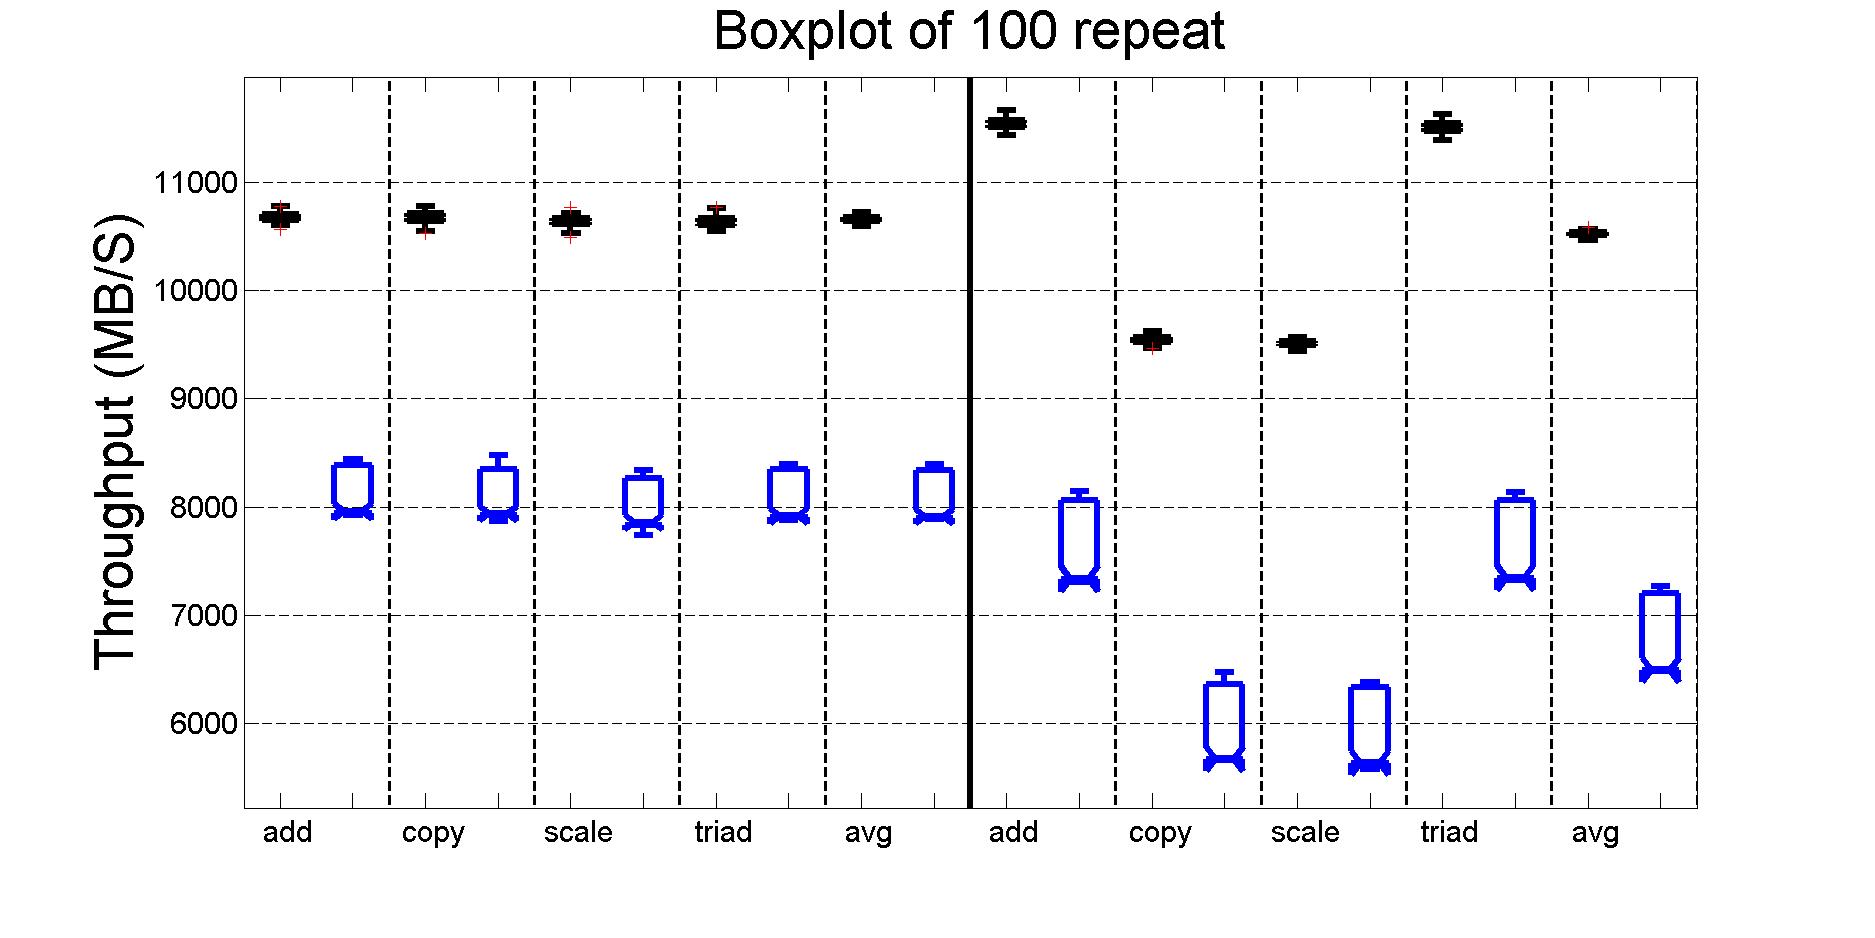
I am using the v2.6, single core version. The command I used is ./ramspeed -b 3 (for int) and ./ramspeed -b 6 (for float).
The benchmark measures four operations: add, copy, scale, and triad. And also gives an average number for all four operations.

The results in DomU shows around 20% performance degradation compared to non-virt results.

Attached is the results. The left part are results for int, while the right part is the results for float. The Y axis is the measured throughput. Each box contains 100 experiment repeats.
The black boxes are the results in non-virtualized environment, while the blue ones are the results I got in DomU.

The Xen version I am using is 4.3.0, 64bit.Â

Thanks very much!

Sisu


On Tue, Mar 4, 2014 at 4:49 PM, Sisu Xi <xisisu@xxxxxxxxx> wrote:
Hi, all:

I am trying to study the cache/memory performance under Xen, and has encountered some problems.

My machine is has an Intel Core i7 X980 processor with 6 physical cores. I disabled hyper-threading, frequency scaling, so it should be running at constant speed.
Dom0 was boot with 1 VCPU pinned to 1 core, with 2 GB of memory.

After that, I boot up DomU with 1 VCPU pinned to a separate core, with 1 GB of memory. The credit scheduler is used, and no cap is set for them. So DomU should be able to access all resources.

Each physical core has a 32KB dedicated L1 cache, 256KB dedicated L2 cache. And all cores share a 12MB L3 cache.

I created a simple program to create an array of specified size. Load them once, and then randomly access every cache line once. (1 cache line is 64B on my machine).
rdtsc is used to record the duration for the random access.

I tried different data sizes, with 1000 repeat for each data sizes. Attached is the boxplot for average access time for one cache line.

The x axis is the different Data Size, the y axis is the CPU cycle. The three vertical lines at 32KB, 256KB, and 12MB represents the size difference in L1, L2, and L3 cache on my machine.
The black box are the results I got when I run it in non-virtualized, while the blue box are the results I got in DomU.

For some reason, the results in DomU varies much more than the results in non-virtualized environment.
I also repeated the same experiments in DomU with Run Level 1, the results are the same.

Can anyone give some suggestions about what might be the reason for this?

Thanks very much!

Sisu

--
Sisu Xi, PhD Candidate

http://www.cse.wustl.edu/~xis/
Department of Computer Science and Engineering
Campus Box 1045
Washington University in St. Louis
One Brookings Drive
St. Louis, MO 63130


--
Sisu Xi, PhD Candidate

http://www.cse.wustl.edu/~xis/
Department of Computer Science and Engineering
Campus Box 1045
Washington University in St. Louis
One Brookings Drive
St. Louis, MO 63130

Attachment: cache_ramspeed.jpg
Description: JPEG image

_______________________________________________
Xen-devel mailing list
Xen-devel@xxxxxxxxxxxxx
http://lists.xen.org/xen-devel


Rackspace

Lists.xenproject.org is hosted with RackSpace, monitoring our
servers 24x7x365 and backed by RackSpace's Fanatical Support®.